Install the app from Play Store in the usual way. Here’s a QR code to take you there.
The BatGizmo Android App is a free and open source app for displaying spectrograms of bat calls.
- View live spectrograms from a suitable ultrasonic microphone.
- View previously recorded sound files, including downloads from social media and other web sites.
- Suited to both small and large devices due to efficient use of screen space.
- Audio output can be generated live and stored data by heterodyning, including dual heterodyne mode.
- Record data to industry standard .wav files, including GUANO metadata.
- Recordings can be triggered manually or automatically.
- Most settings have automatic and manual mode, combining simplicity of use with flexibility.
- Automatic microphone response correction.
- Large data files are handled elegantly with paging, so you are not limited by the memory in your device.
- Open source: https://github.com/jmears63/batgizmo-app-public
MIcrophone Compatibility
The app supports USB Full Speed, UAC1, and UAC2 microphones—generally those up to 384 kHz for bat recording. Higher sampling rate microphones are not currently compatible. Field reports of known compatible microphones will be added to the list below as they become available.
Known compatible microphones (alphabetical):
- Anugerah Services Vleermuis microfoon
- Apodemus pipistrelle mini
- Audiomoth with USB microphone firmware
- BatGizmo hardware (to be open sourced at some point)
- Dodotronic Ultramic 250K, Ultramic 384k BLE
- Echometer Touch 2 @ 256 kHz
- Echometer Pro @ 256 kHz, mixed reports @ 384 kHz.
- Griff self build
- Pettersson U256 and U384
- Pettersson M500-384, but not the 500 kHz sampling variant (M500).
Known incompatible microphones:
- Any microphone whose sampling rate is more than 384 kHz, such as the Pettersson M500.
Device Compatibility
This app is compatible with Android 11 and later. Note that there are minor differences in appearance between Android 11 and subsequent versions.
This app makes use of hardware graphics acceleration for smooth and fast spectrogram updates. This is dependent somewhat on the Graphical Processing Device (GPU) used by the device in question. On devices with lower spec GPUs, you may notice that screen updates become coarser and more jerky in some situations. It can happen when the FFT window size is small, or the window overlap is large, or the device screen is high resolution, or a combination of those things. You can generally avoid it by manually adjusting the FFT window size upwards and the overlap downwards, in the settings screen.
Using BatGizmo as viewer
The app can generate spectrograms from standard .wav files, extracting GUANO metadata if present. Files can be opened in two ways: via the View File menu option, or by clicking on the file in another app or notification.
Viewing via the main menu option
If you know where the file you want is stored on your device tap the View File option from the main menu. You will be presented with the standard Android document opener which allows you to select a file. Files previously recorded by BatGizmo can be found by tapping your device name, Documents, BatGizmo.
Some downloaded files can be found under “Downloads”. However, certain apps, including the Facebook app, download files into their own private storage space on the device so they don’t appear under “Downloads”. In this case, you need to use the next method to view that file. This is a feature of certain apps.
Sometimes its useful to be able to selection multiple files to view. For example, all the files in a certain folder or on an inserted USB drive. The document opener can be used to select multiple files or all files in a folder. Select specific files by tapping on the icon to the left of each files required; select the entire list by tapping the three tops near the top right corner, and “select all”. You can then navigate between selected files using the up and down arrow buttons.
Viewing by tapping in other apps
BatGizmo is registered with the device as a viewer of .wav files. That means that you can use the My Files app or similar to locate a .wav file of interest, and just tap on the file to view it within BatGizmo. Likewise, if you download a .wav file from a web site, you can tap the “Download complete” notification to view the file in BatGizmo.
For example, to view a .wav from a Facebook group, follow these steps:
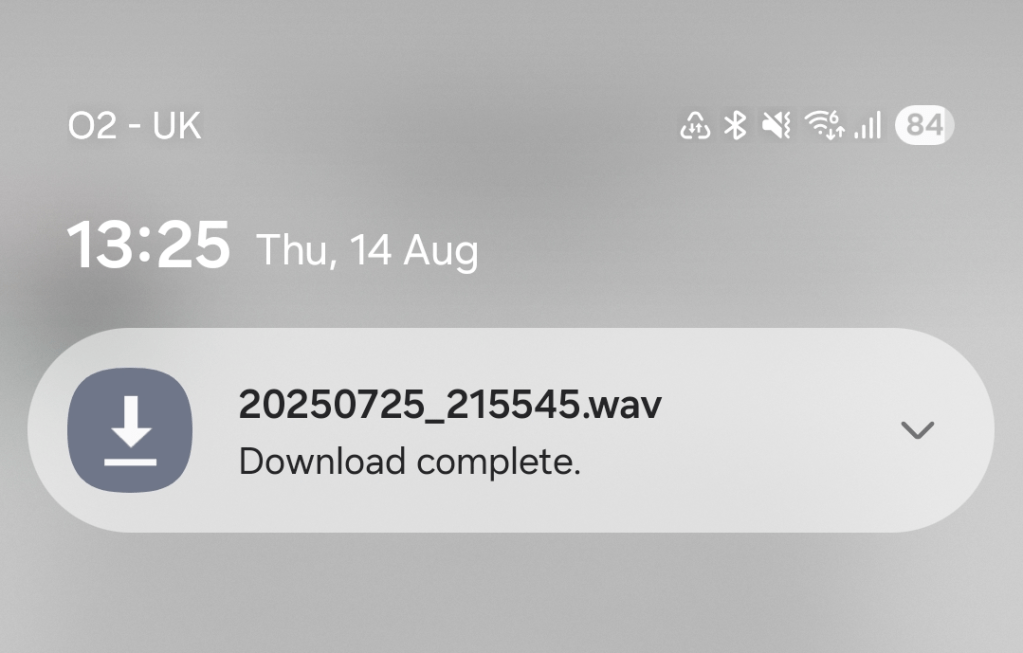
(1) Tap on the file to be downloaded in the Facebook app, in this case, 20250725_215545.wav.
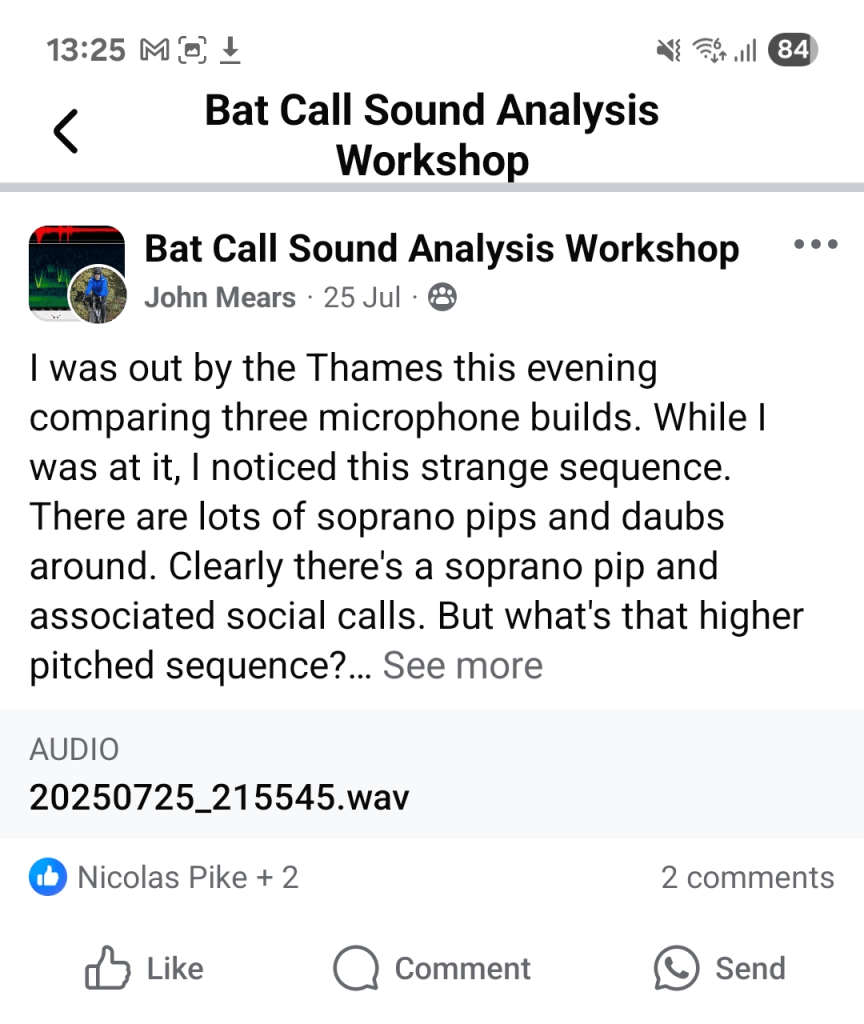
(2) When the file has downloaded, a downloaded symbol will appear at the top the screen. Swipe down to expand the notification as shown, and tap on it to view the file in BatGizmo.
Note that to view it again, you need to download it again within the Facebook app. That’s a limitation of the way the Facebook app goes about things
Working with a spectrogram
When a spectrogram is being displayed, either from a file, or from live microphone data, you can modify te display in various ways as follows.
Use various gestures to pan and zoom the display as listed.
| Gesture | Action |
| Pinch (thumb and first finger is convenient) | Zoom in or out of a region. |
| Drag with one finger | Pan the display, preserving the current zoom level. |
| Hold and release with one finger | Pan that point to the centre of the display, if possible. |
| Double tap | Reset to full view. |
Click on the cross in the top right corner to close the viewer.
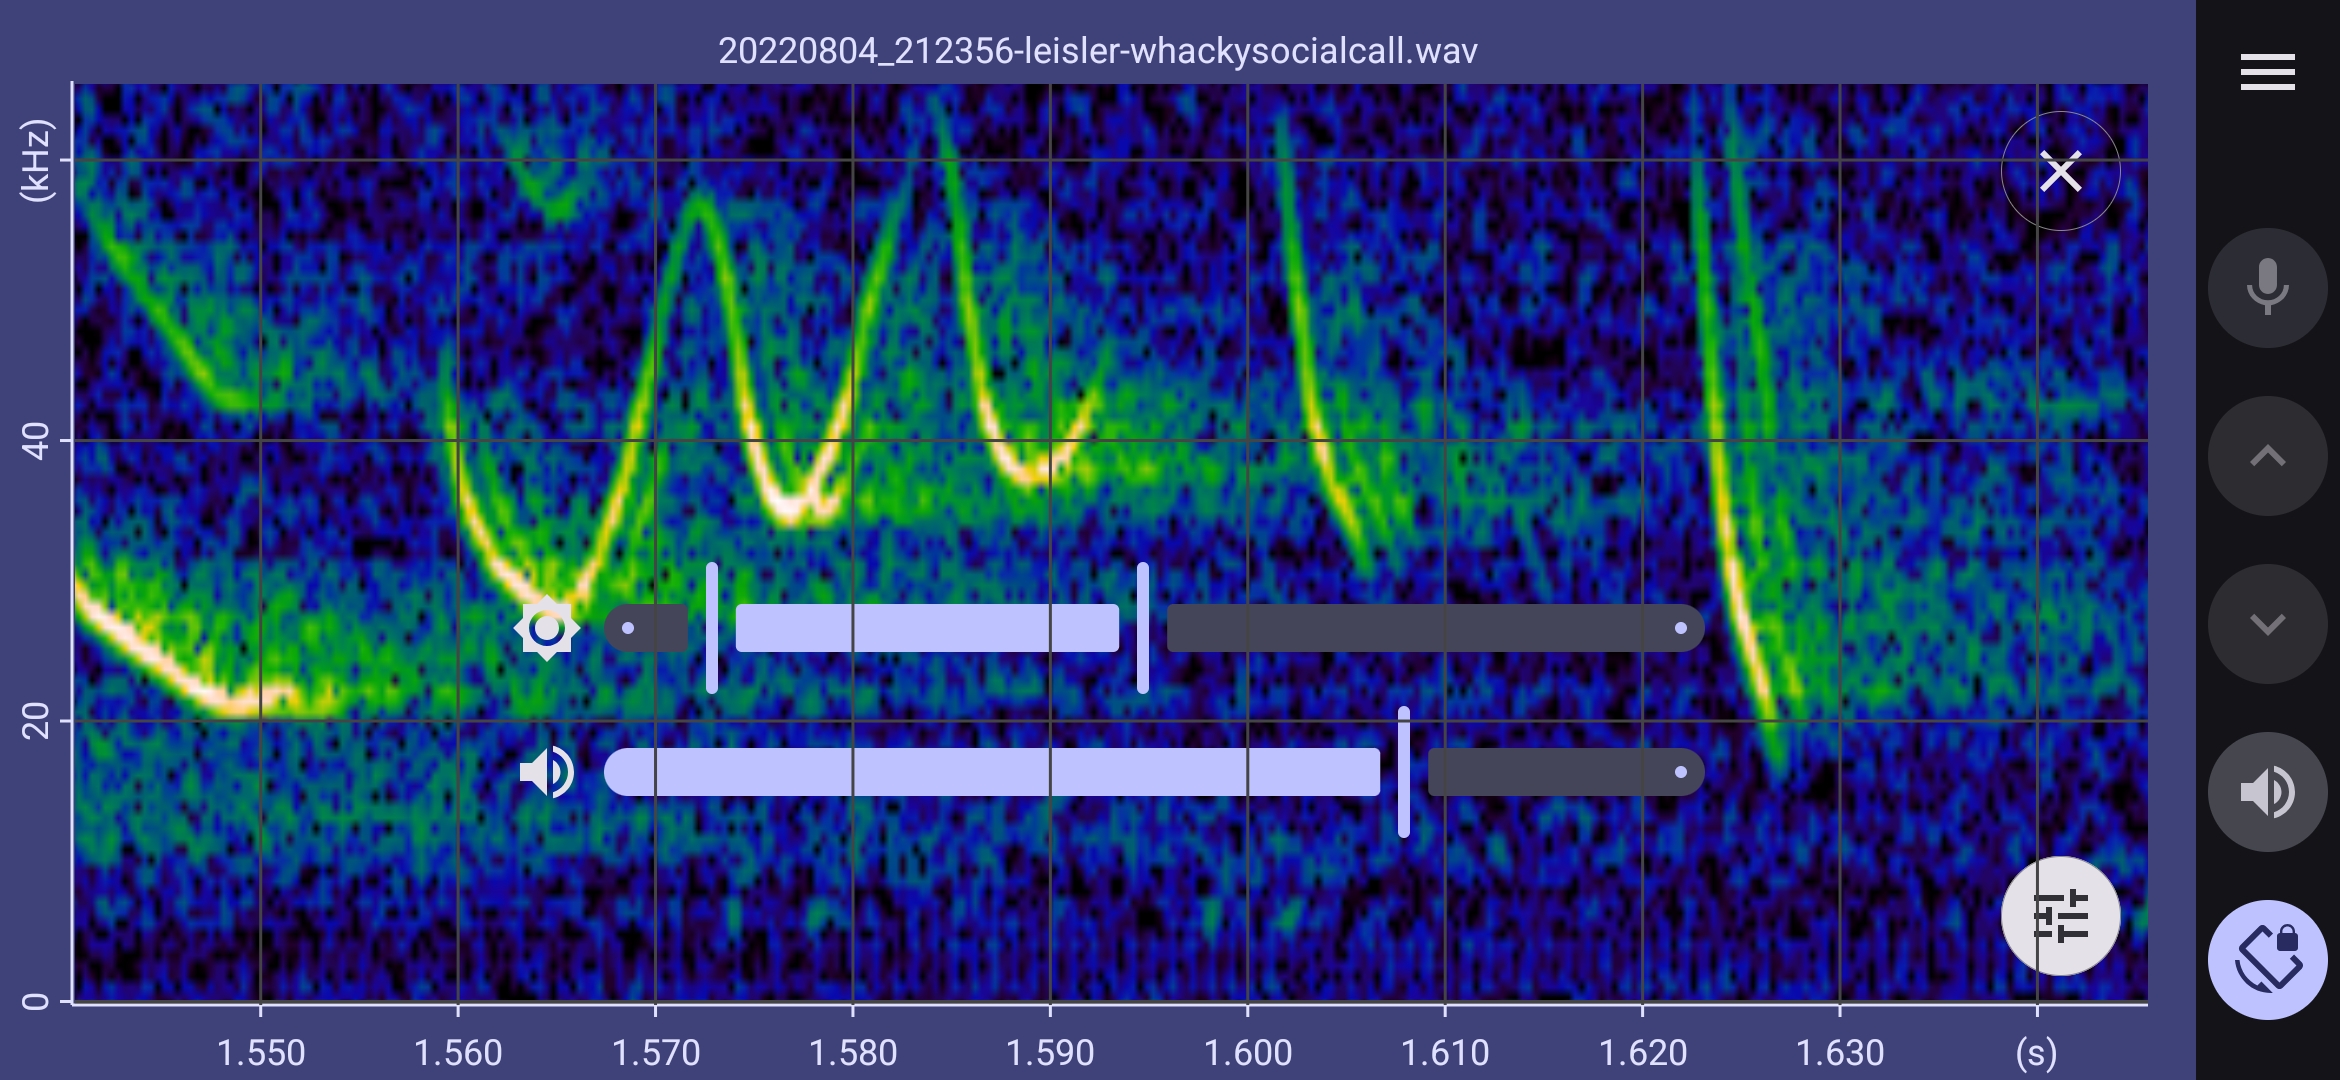
Colour mapping
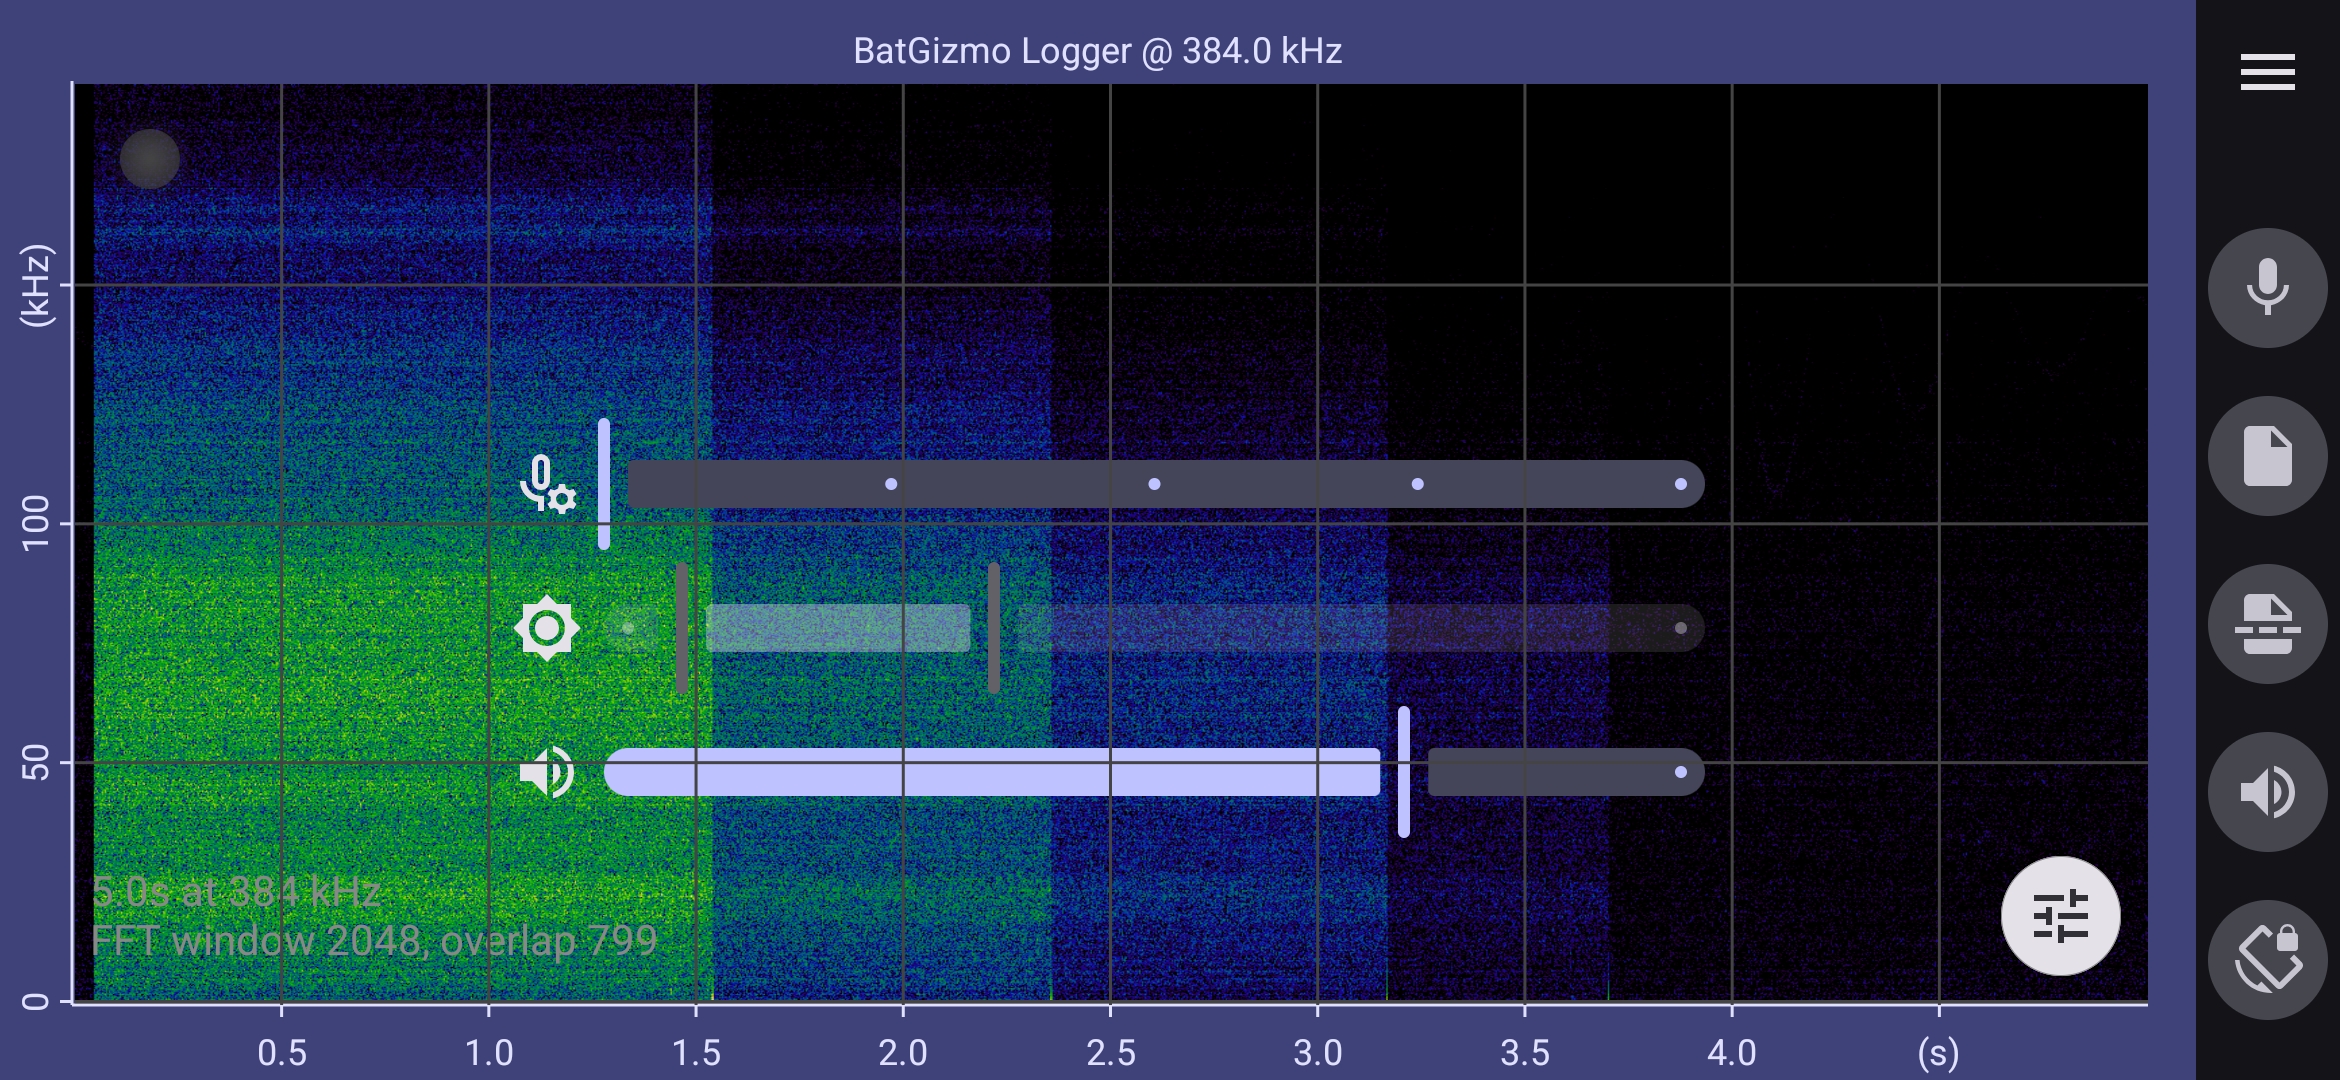
The brightness and contrast of the spectrogram display is determined by the way spectrogram data is mapped to colour. This is a linear mapping in BatGizmo, specified by the range of spectrogram values that map to the full range of the colour scale.
By default, colour mapping is selected automatically when a file is loaded or zoomed or panned. By default, in live mode, the range needs to be manually tuned by the user for optimum visibility of bat sounds. The choice of manual versus automatic selection can be set for each mode via Settings.
In manual mode, the sliders button  in the bottom right of the display is enabled. Tapping this button overlays the spectrogram with range sliders, including one that can be used to adjust the appearance of the display. Make adjustments by dragging the left or right slider control with your finger, or tap to either side oft the control. Tap the sliders button again to hide the slider.
Pagination of large data files
If your data file is larger than the configured data buffer size (see Settings), it will be displayed in paged mode. The data is displayed in pages, and paging buttons  and
and  are overlaid on the display to move to the next and previous pages. Panning and zooming only applies within the current page.
Viewing file metadata
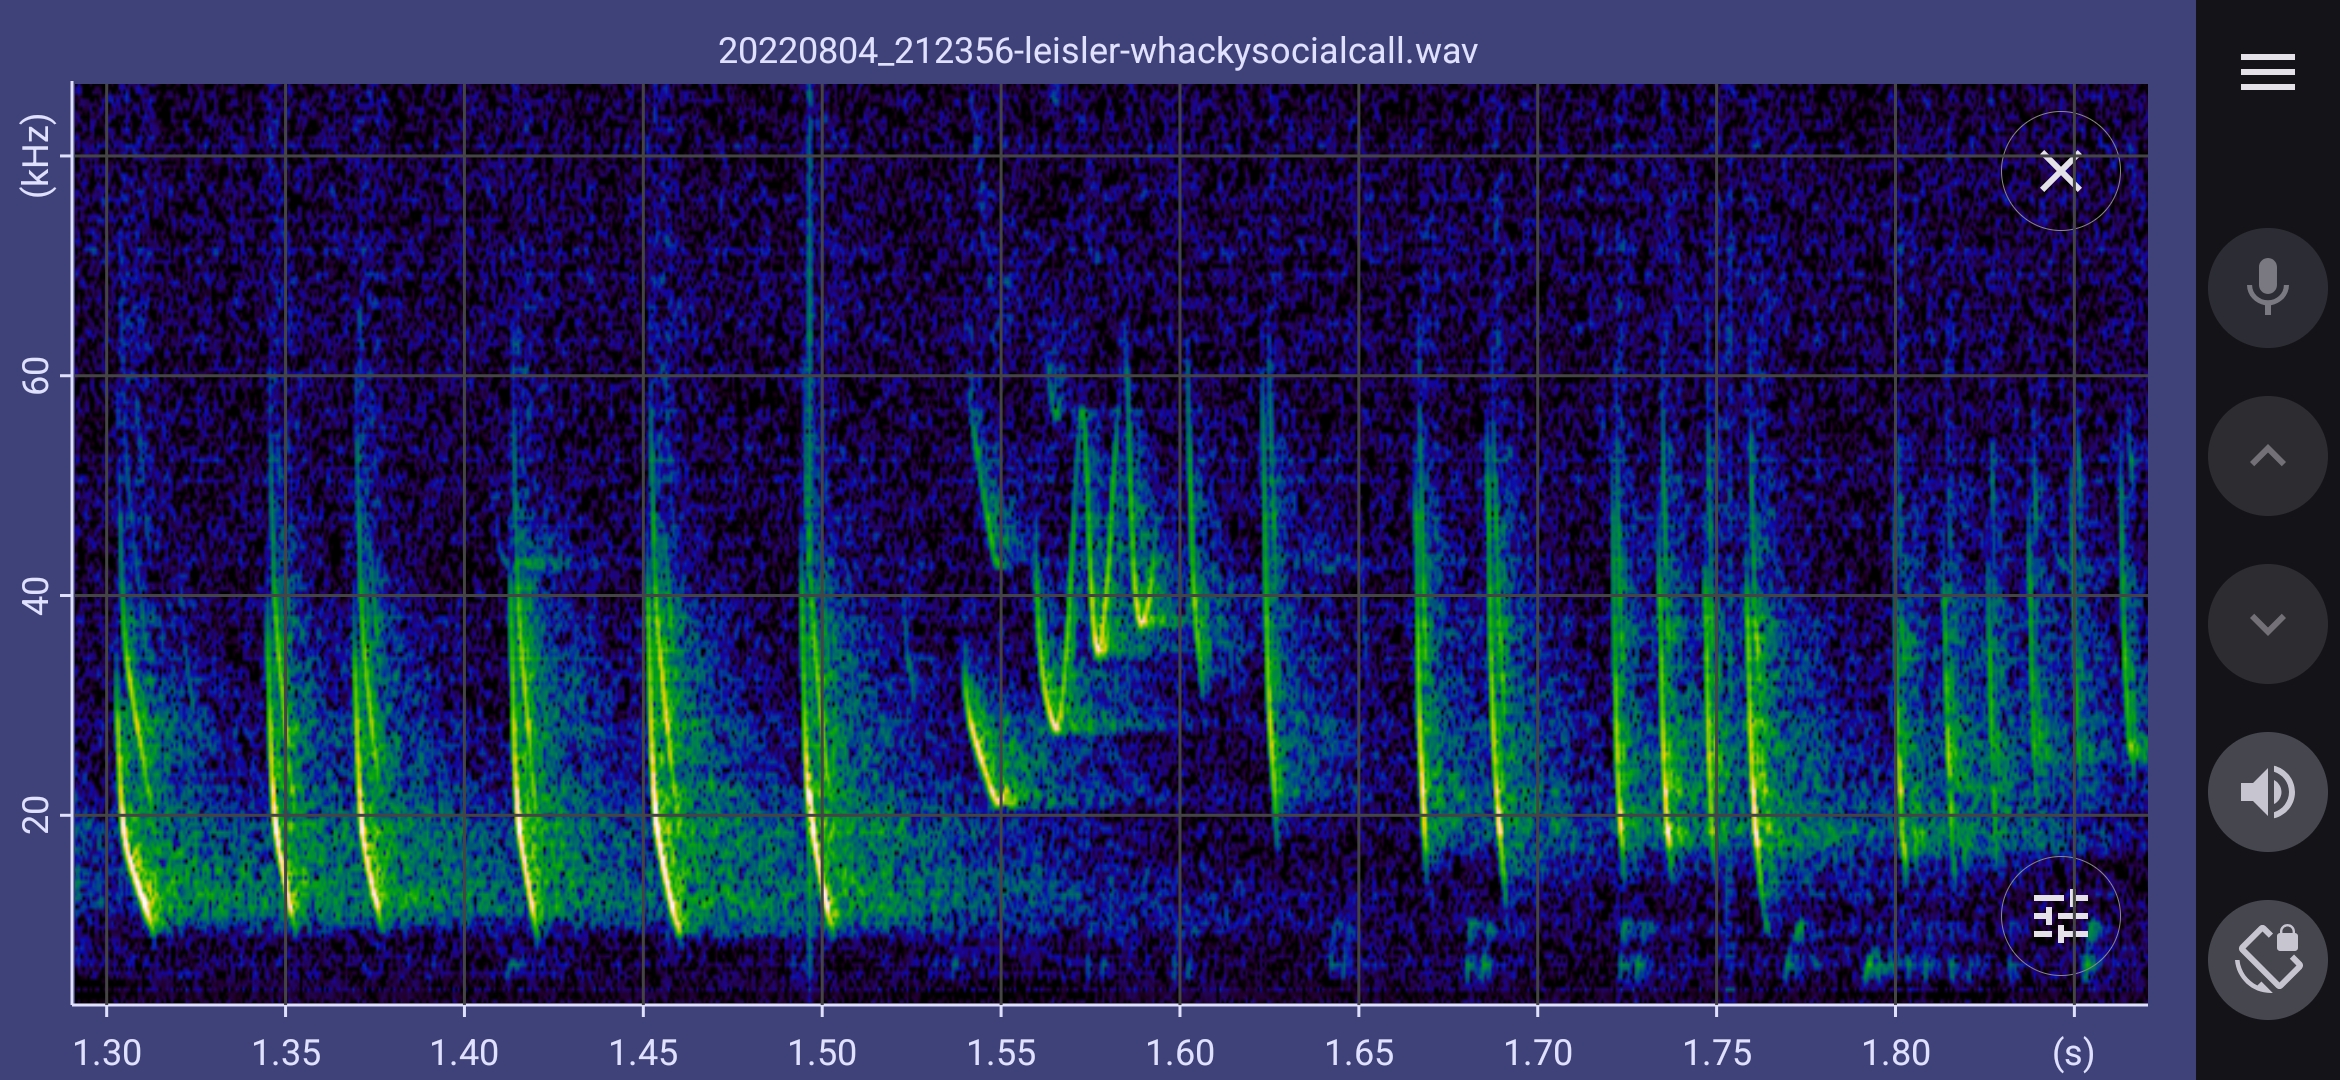
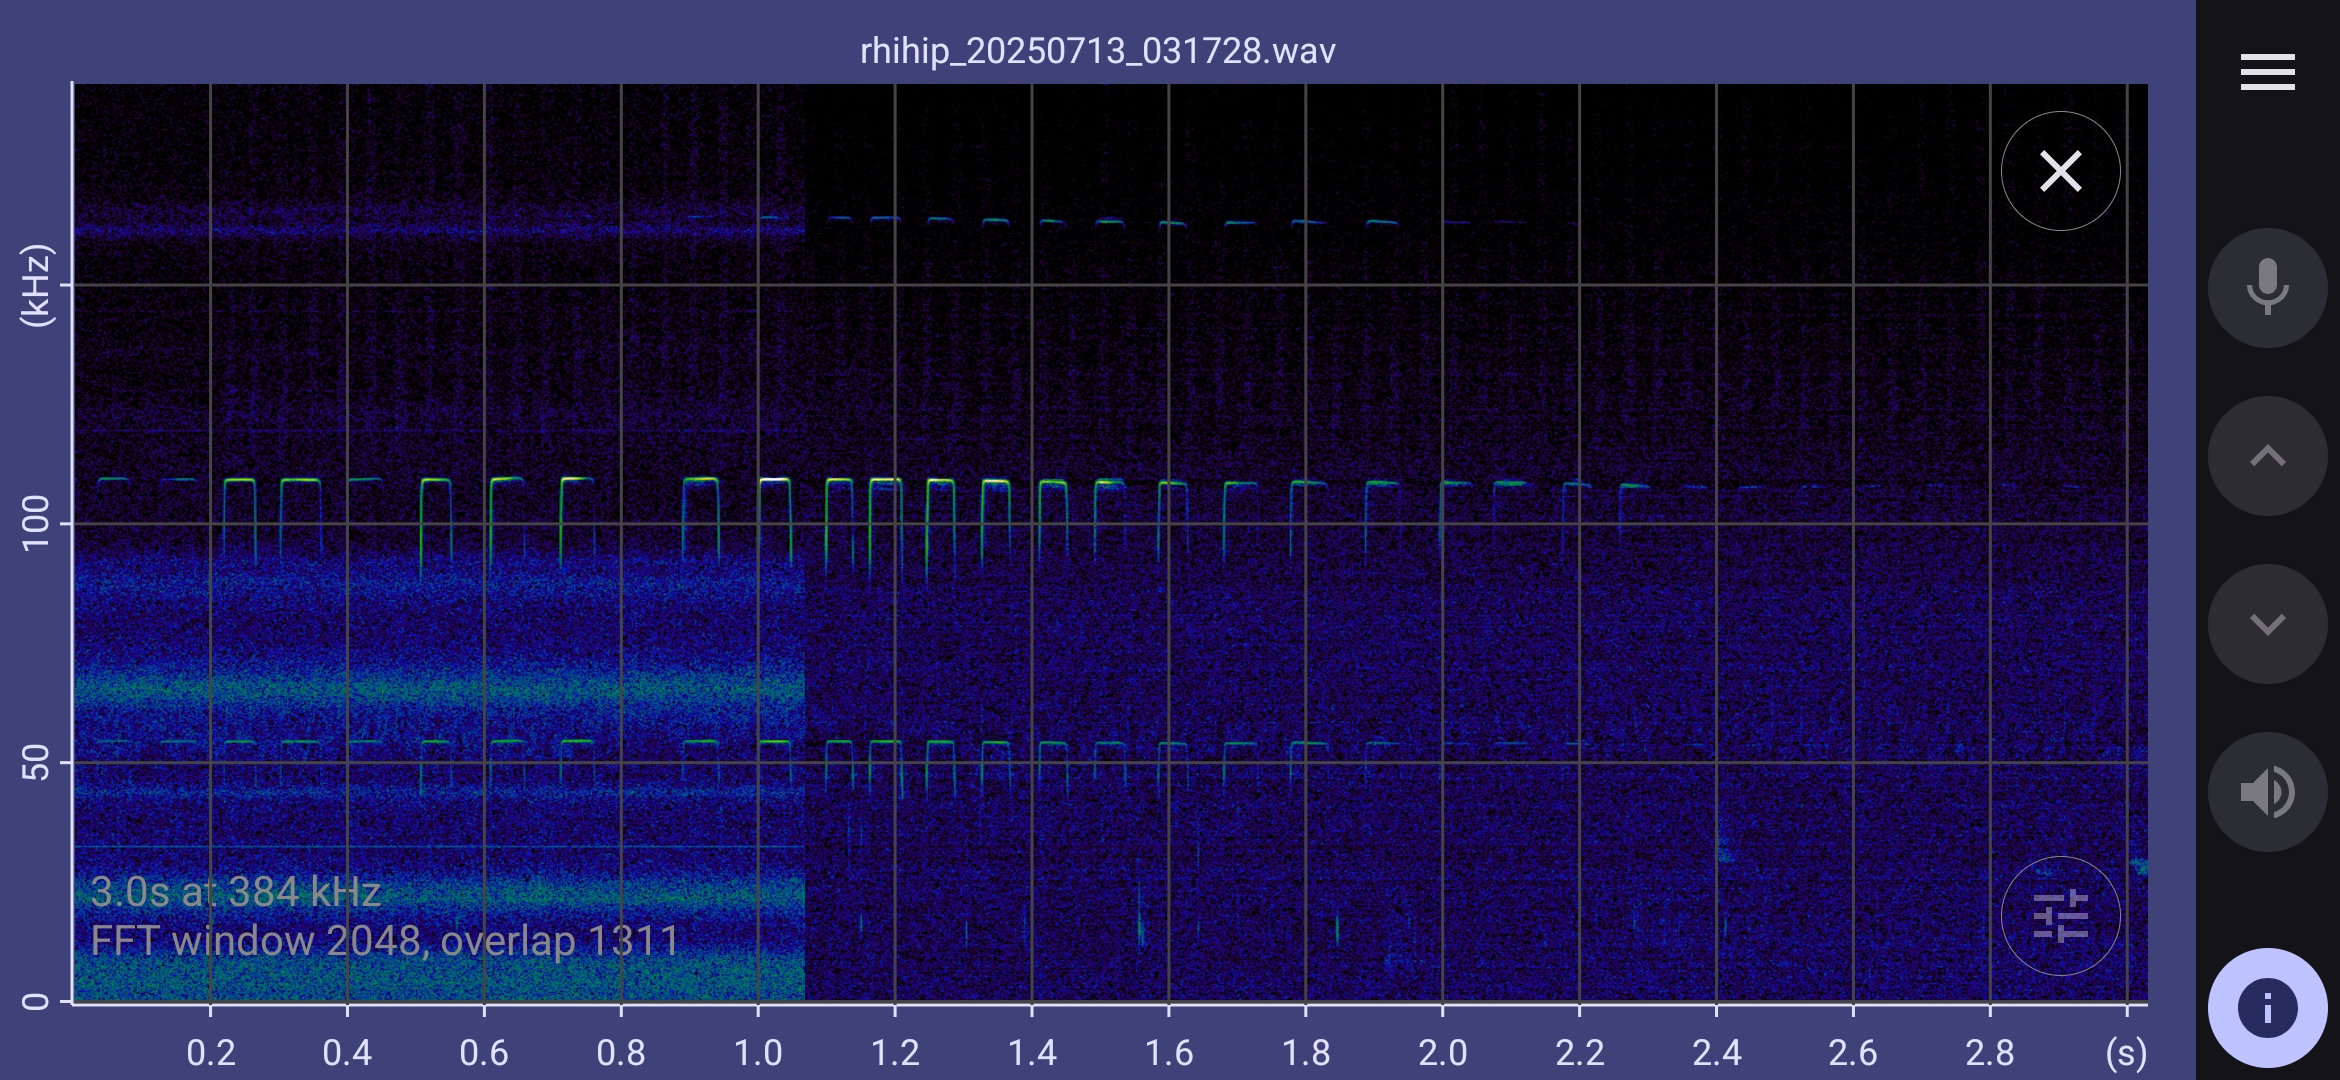
When you are viewing a spectrogram from file, you can select File Info from the main menu to view file metadata, which is a scrollable list. This includes basic .wav file parameters, and any GUANO data present. If the location is included in GUANO, a tappable location button is displayed – tap it to jump to location in Google Maps.#
Microphone noise correction
Lower cost bat microphones typically use MEMS microphone elements. These can work very well, but generally they have some resonances resulting in uneven frequency response. This is visible as noise bands in the resulting spectrograms. BatGizmo has a feature to detect and correct for this so that the noise background is flat*. This largely corrects the microphone frequency response, making it easier to judge the frequency of maximum energy (FmaxE), and generally improving the aesthetics of the spectrogram.
This feature is somewhat experimental so is turned off by default. Turn it on by checking the appropriate box in the Settings screen.
*The noise spectrum is corrected to be flat up to 80 kHz and roll off slowly and evenly above that point.
Using BatGizmo for live data
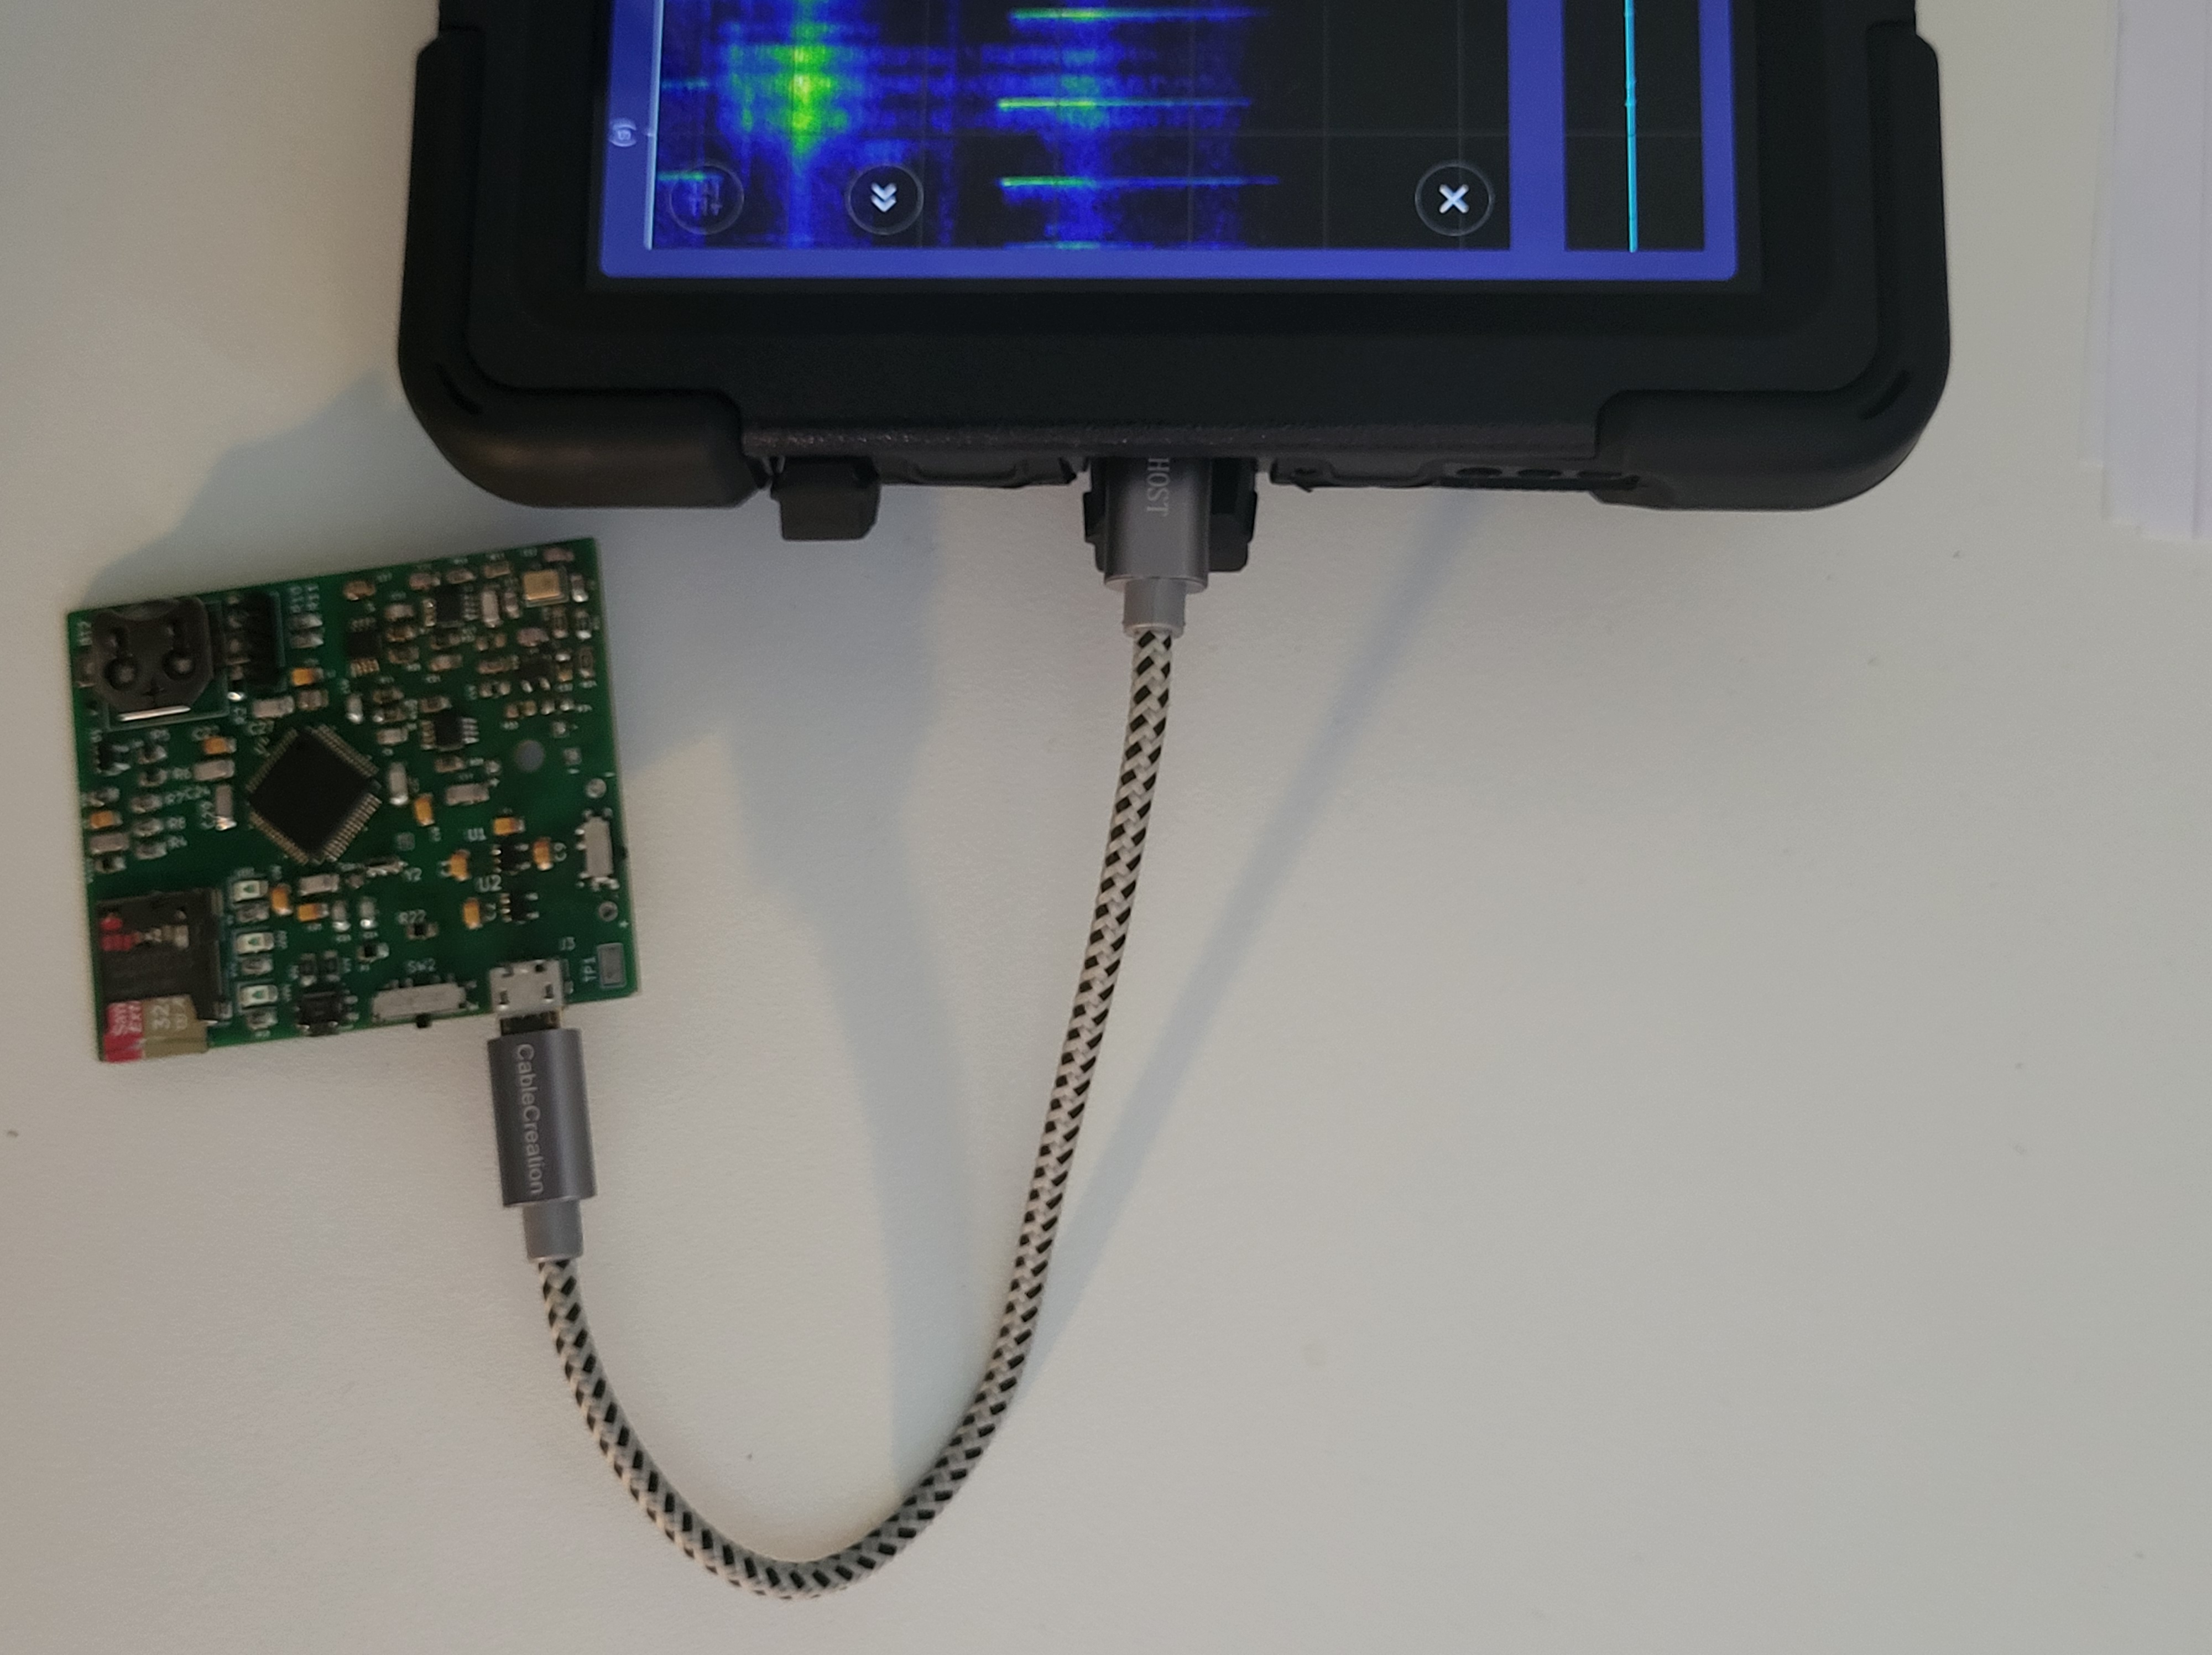
BatGizmo can display live spectrograms based on data from an external USB microphone. There is currently no support for doing this from the device’s own microphone, as they typically lack sufficient bandwidth. BatGizmo has support for USB AUC version 1 compliant microphones, which is the majority of microphones intended for bat recording. It also has limited support for UAC version 2, used by a minority of bat microphones.
To view a live spectrogram, follow these steps:
- If you are currently viewing data from a file, close that view by clicking on the cross near the top right of the display.
- Plug your USB microphone in to the device. You must use an On The Go (OTG) cable intended for connecting a USB host (your phone or tablet) to a USB device (the microphone). It’s not going to work otherwise.
- The app will ask you to grant it permission to use the microphone. Do so.
- Tap the microphone button
 . You should start seeing live spectrogram data, and a green indicator displayed near the top left of the screen indicates that data is flowing. Tap the button again to pause or resume live data rendering.
The indicator changes colour to show recording status – see below. In live mode, tap the sliders button to adjust the colour mapping for maximum visual clarity.
Audio output
Audio output can be enabled, from live microphone data, and also from stored filesa. Audio output is generated from normally inaudible ultrasonic bat sounds by the technique of heterodyning.
Heterodyning is based on a centre frequency which is tuned according to the kind of bat of interest. For example if you are interested in greater horseshoe bats, you might tune the heterodyne to 83 kHz, the typical frequency of their calls.
BatgizmoApp allows two channels of heterodyne to be configured. For example, if you are interested in both greater and lesser horseshoe bats, you might tune a channel to 83 kHz and a channel to 110 kHz.
Tap the audio button  to enable audio output. You the first time, you will be prompted to configure heterodyning.
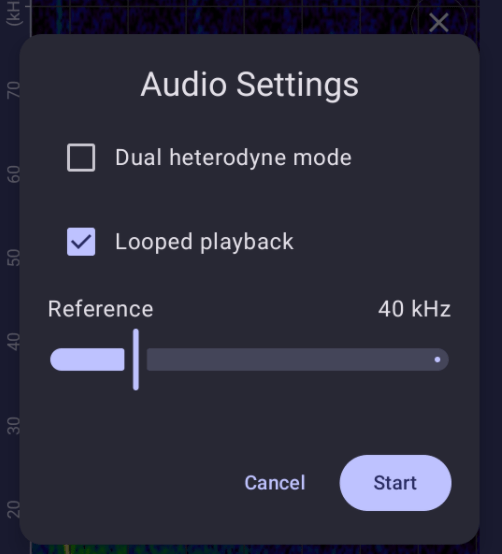
Up to two heterodyne channels can be configured. The initial reference frequency for each be set with a slider, and subsequently adjusted as described below.
Looped playback can be enabled in viewer mode to repeatedly loop through the visible data.
Note that audio will be directed to the device’s default audio output. That typically a bluetooth device if connected, otherwise, device’s internal speaker. I recommended using headphones for clarity of sound and avoidance of self recording.
Subsequent taps on the audio button will enable and disable audio, and end looping through data. To access the audio configuration again subsequently, hold your finger for several seconds on audio button.
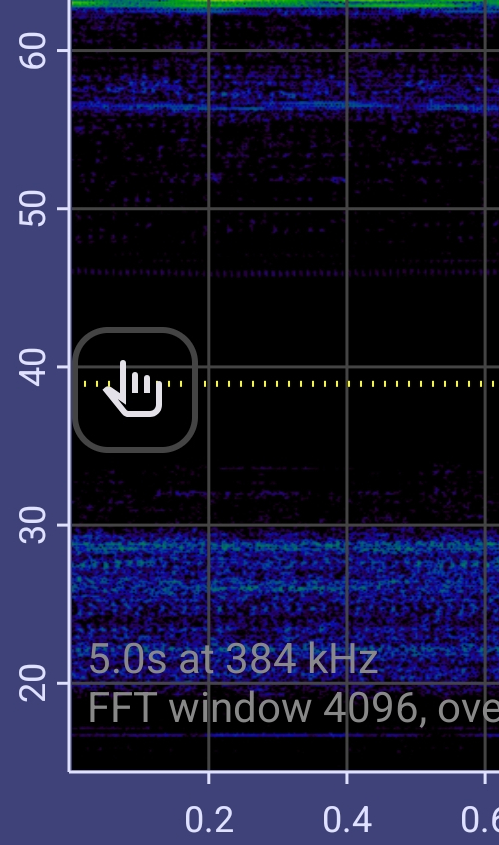
While in heterodyne mode, the tuning frequency is indicated with a dotted yellow line. You can change it by dragging the hand symbol.
Recording to File
When you are viewing live spectrogram data from microphone, you can record the raw data to file. Files are in the standard .wav format, with GUANO metadata included to include the microphone type, location, etc. Files are written to the device’s internal storage, and can be found under Documents | BatGizmo. They are stored in date folders, and the files themselves are named by date and time (example: 20250809_192548.wav). You can access them using other apps, such as file browsers.
You can also access files externally from a computer or another device by connecting your device to it using a suitable USB cable. This is a good way to transfer files for analysis elsewhere, though it is also possible to email individual files, or upload them to Google Drive.
Triggered recordings can include data for a short period before the trigger, and for a fixed time after the last trigger in triggered mode). Files will automatically be split into multiple files when the length would otherwise exceed the maximum file length. This can be configured in Settings.
Manual Recording
Start and stop manual recording by tapping the manual recording button:  . The indicator lamp near the top left of the display turns red to show that data is being recorded.
Triggered Recording
In triggered recording mode, recording starts when a suitable trigger sound is detected. Triggering parameters (frequency range and power) can be configured in Setttings.
Start and stop triggered recording by tapping the triggered recording button:  . The indicator lamp near the top left of the display turns orange to show that it is waiting for a trigger, and red to show when data is actually being recorded.
Microphone Sensitivity Control
Some microphones offer different sensitivity (gain) ranges. They advertise this capability over USB, and if present, the app will offer this capability via an additional slider.
Note that some microphones advertise this capability but then silently ignores the request to set the sensitivity. I’m looking at you, EMT2. This is unhelpful, and will perhaps be fixed by Wildlife Acoustics in due course. In the meantime, the app will display the slider, but the setting will be ignored by the EMT2.
Screen Orientation
BatGizmo works in both portrait and landscape orientation. It also allows inverted portrait mode which is convenient when a dongle style detector is plugged into the USB port. However, note that some device manufacturers prevent inverted portrait from mode being used.
It can be convenient to lock the app into the current screen orientation. This can be achieved by tapping the lock orientation button, which looks like this:  . Tap it again to unlock the orientation.
It’s also possible to lock the orientation of the app from from Android Quick Settings panel. This setting can interact with the lock orientation button in a confusing way, which depends somewhat on the device manufacturer. I recommended only using the button in the app, as just described.
Settings
Most settings have default values that typically do what you want. However, in certain situations you may want to change the app’s behaviour ways as described below.
| Setting | Description |
| Dark theme | When this is checked, certain parts of the app are darkened to reduce dazzle on a dark night. |
| Show parameter overlay | Text describing technical parameters of the spectrogram is overlaid on the spectrogram. |
| Show grid | A grid is overlaid on the spectrogram, aligned with axis ticks, so values can be more easily read from it. |
| Buttons on the left | When in landscape mode, the buttons can be on the left or right side of the spectrogram. Choose the button location that is most convenient for you. |
| Display amplitude pane | This controls whether the amplitude (oscillogram) graph is shown. On a small device in landscape mode you may prefer not to show it, to leave more space for the spectrogram. |
| Auto Brightness/Contrast | This controls whether colour mapping is done automatically or manually, for live and for viewer mode. |
| Noise correction | Turn on noise background whitening. This setting turns on automatic compensation for the microphone’s noise background spectrum, resulting in a flattened spectrum. Some microphones, typically MEMS microphones, have an uneven frequency response resulting from microphone resonances. Turning on this setting results in the noise spectrum being automatically adjusted to be flat. This has the effect of largely correcting for MEMS microphone resonances. |
| Live acquisition time span | This is the time axis span that will be set when you tap the live acquisition button to start or resume data streaming. This is convenient when you pause acquisition, zoom in to view details, then resume acquisition. Select “Use existing” if you don’t want the time axis span to be changed. |
| Large file paging overlap | This controls the overlap between subsequent pages in paged viewing mode. |
| FFT window size | This controls the number of raw data points in each FFT calculation. A large value gives more frequency resolution at the expense of time resolution, vice versa for small values. In auto mode, values are automatically chosen based on the axis ranges and screen aspect ratio. |
| FFT window overlap | This controls the overlap between FFT windows. Greater overlap results in a smoother display at the expense of slower calculation. In auto mode, values are chosen based on the screen zoom level. |
| Maximum viewable time span | This controls the *maximum* length data in seconds that can be viewed at once. If a file longer than this is viewed, paged display will be used. This is the maximum zoom out that you can use in live mode. This setting is intended to limit the total memory used by the app to the practical limits of your device, determined by the hardware spec (available memory, GPU capabilities) and whatever apps you might be running at the same time. Typically you set this once per device, then leave it along. If you choose larger values for a lower spec device with a larger screen, you may find that app responsiveness is jerky and delayed in some situations. You may need to experiment. New values only take effect when a new file is viewed or the app is restarted. |
| Include location in files | The current location of the device can be included as part of GUANO metadata in recorded files. You can exclude that information if you wish, for example, to protect a sensitive site. |
| Recording pre trigger | When recording to file starts, some prior data can be included in the recording. This allows quieter sounds in a sequence to be included in the recording |
| Recording post trigger | In triggered mode, recordings will continue for this length of time after the trigger. This allows quieter sounds in a sequence to be included in the recording |
| Recording maximum file length | The maximum length of file that will be written. It’s useful to limit this as some file viewers may have an upper limit on the file size they can handle. |
| Trigger threshold | In triggered mode, this determines the signal level at-which recordings are triggered. The value has no absolute significance. Experiment to find what works. When in live mode, an indicator next to this value will flash red when triggering has occurred, as an aid in finding the best level. |
| Trigger range | The frequency range for triggering. For example, if you are only interested in common pipistrelles, set the range to 40 kHz to 50 kHz. This setting can be used to reduce false triggers. |
| Diagnostic Logger | Enable this to collect diagnostic information to be sent to the developer. |
