A warm evening by the Thames is conducive to insects, and insects attract bats. I decided to take my newly designed and built bat detector for a walk and see what I could find.
Equipment
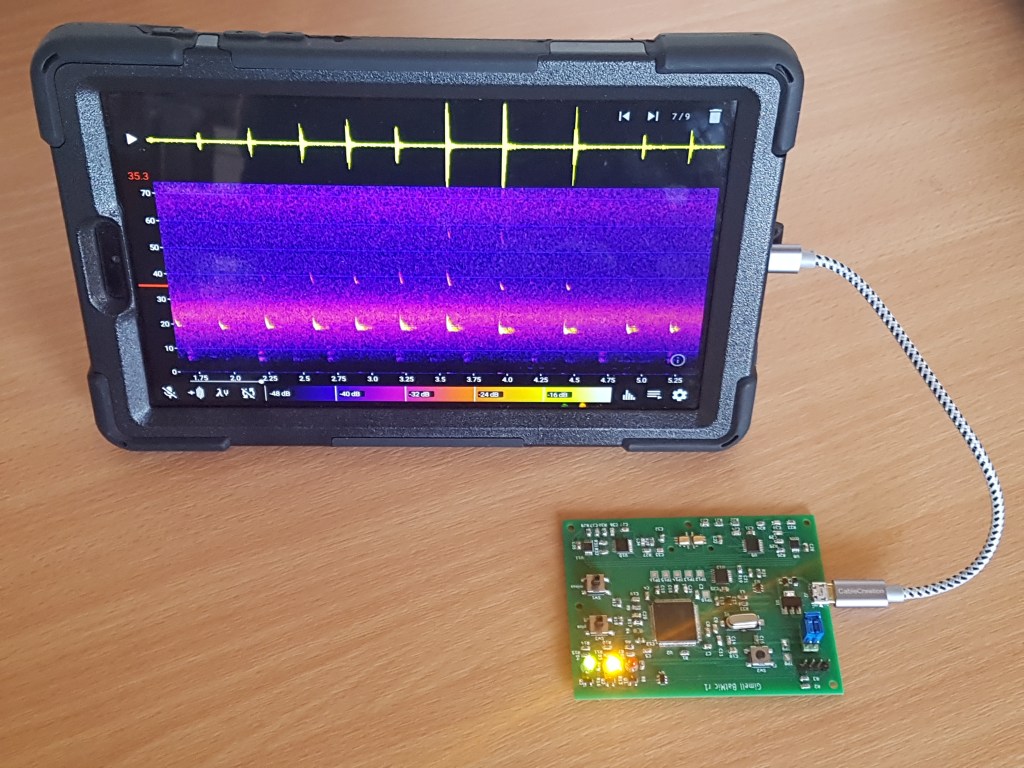
I intend a future geeky blog article about the detector. For now, here is a picture of it. It is a full spectrum detector, with the ability to provide audio heterodyne and frequency divisions outputs, thanks to this excellent app. It has the range and sensitivity to detect any British bat I am likely to encounter.
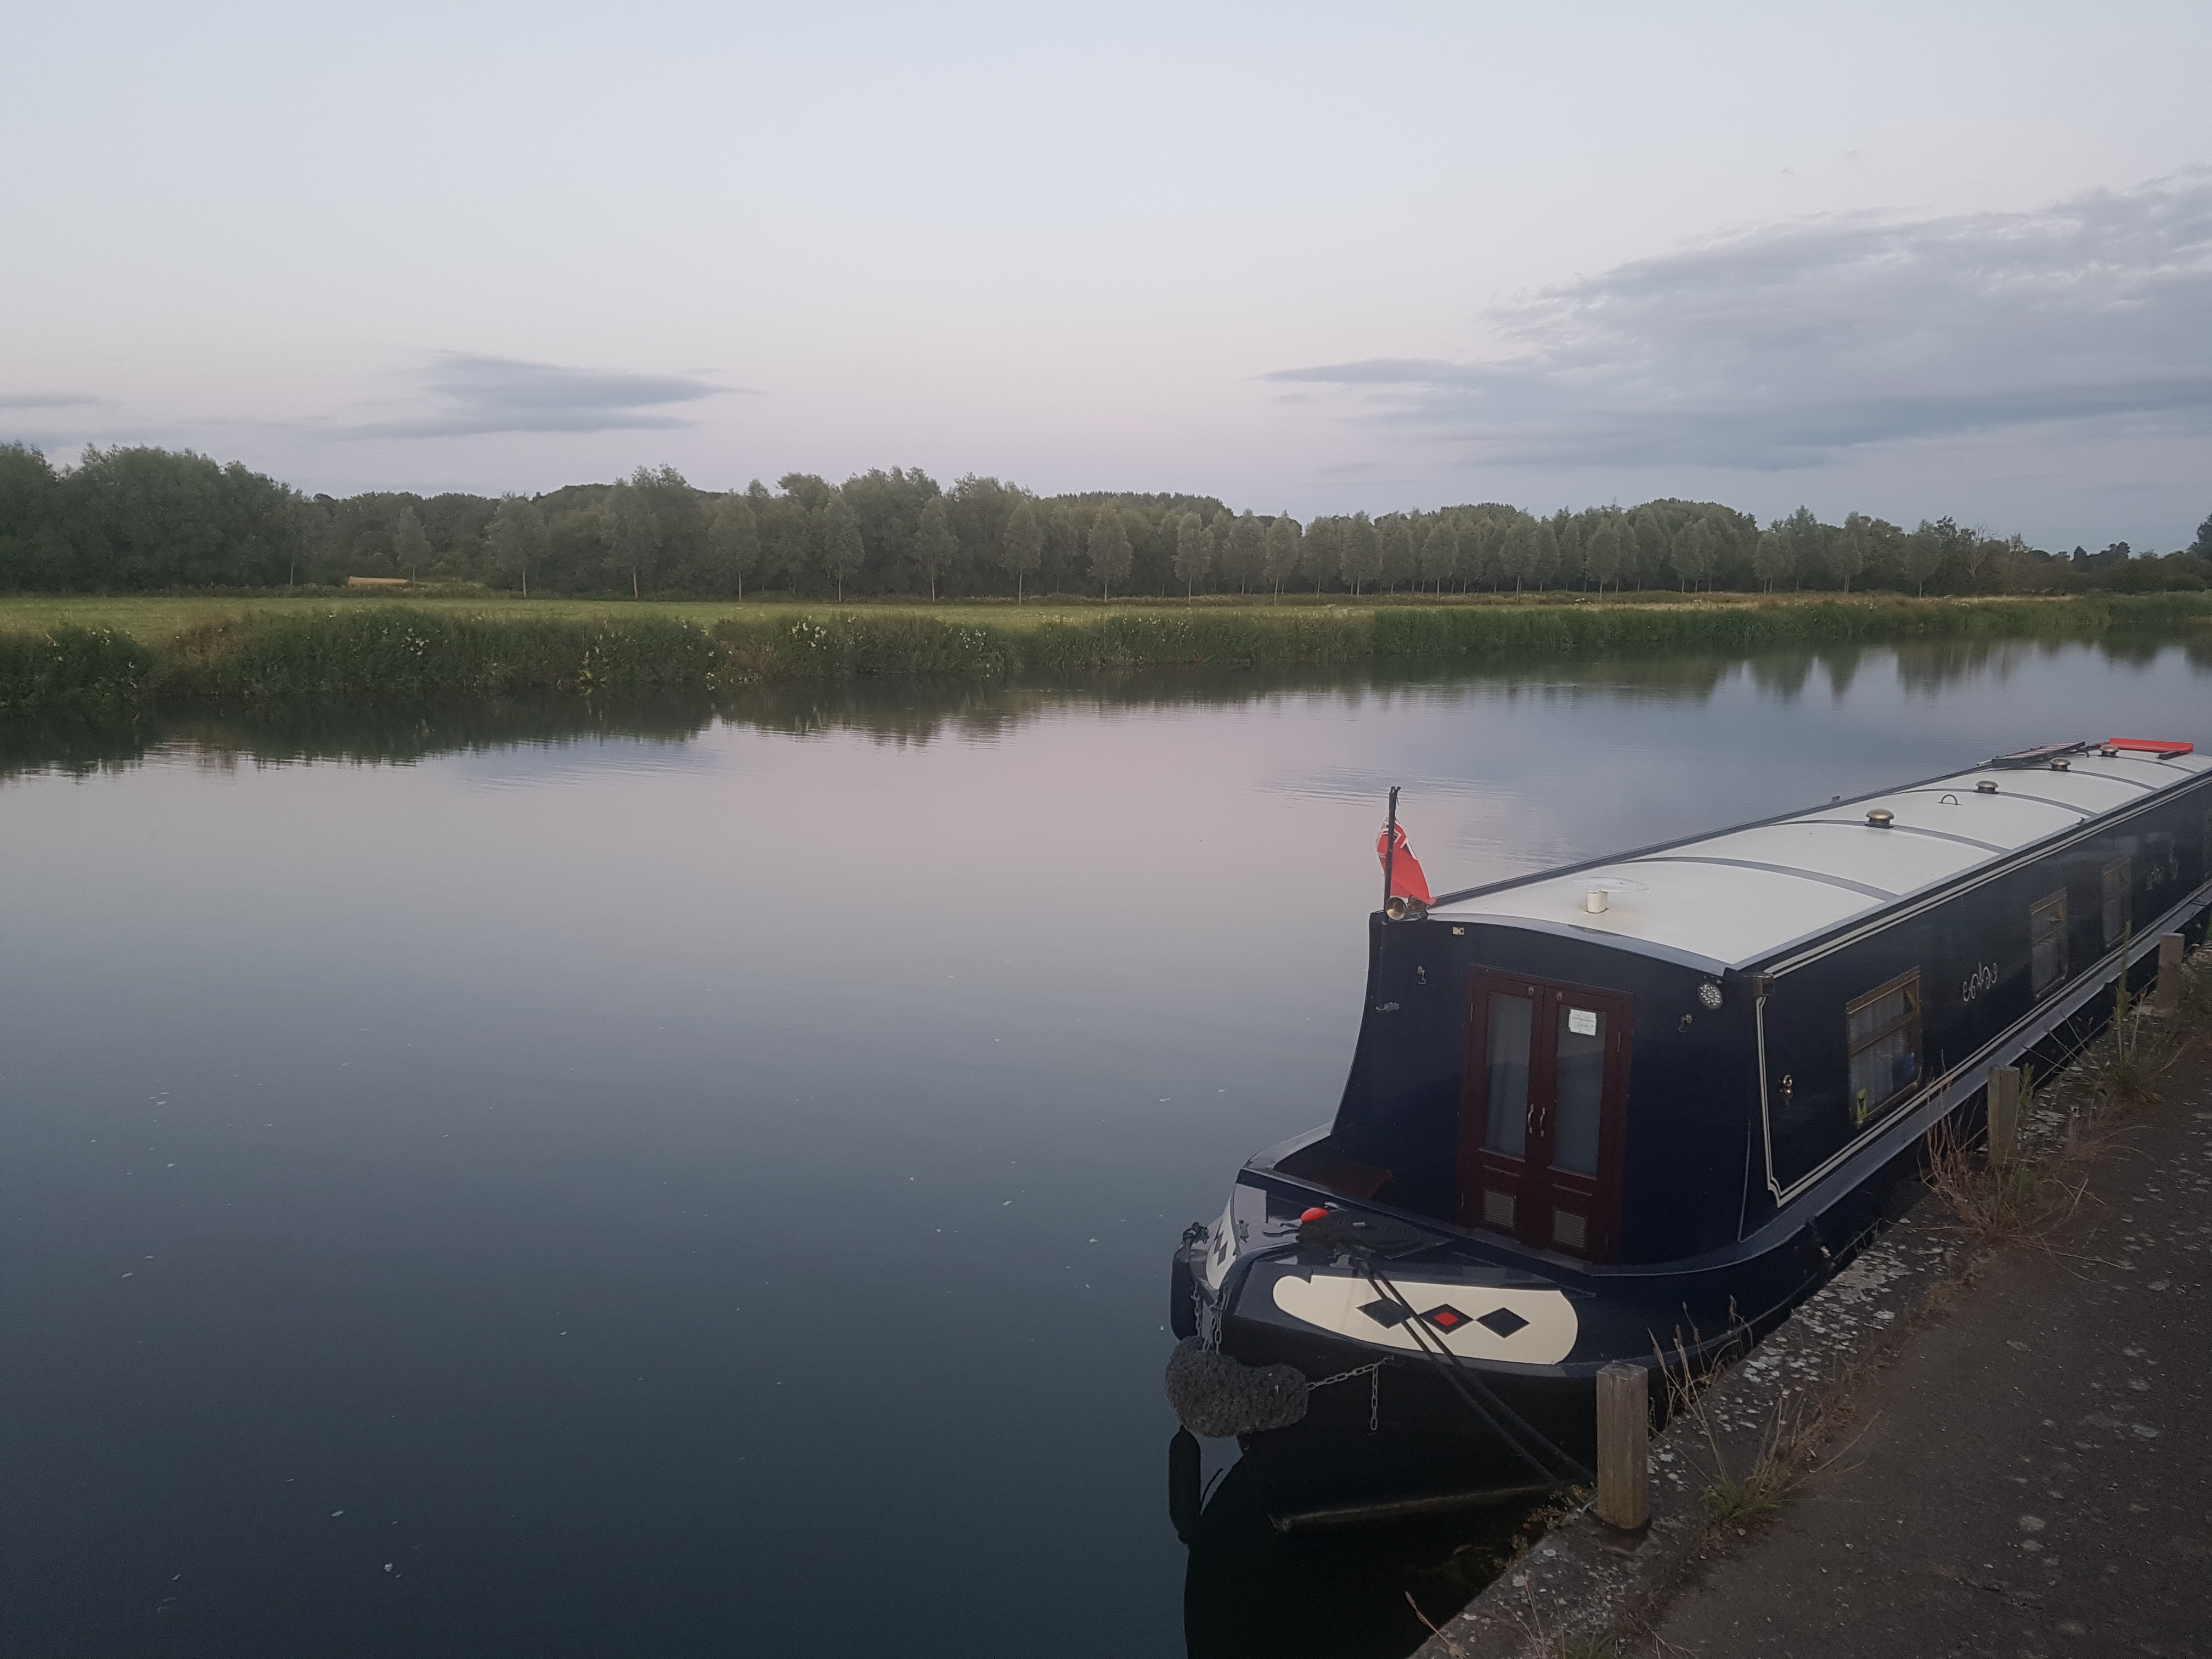
Location
The Sustrans N5 cycle route provides a pleasant northerly way out of Abingdon, through Abbey meadow, then alongside Barton Lane and Barton Fields nature reserve. After a very short ride, less than a mile, you can see some small industrial units on the left (which include Sophos), and a smaller path heads off the the right towards some trees which conceal the river.
I followed that path and locked my bicycle at a small foot bridge, and continued on foot. The Thames path follows the river northwards through some trees. Turned my bat detector on.
Bats
Immediately I picked up pipistrelles loud and clear, common and soprano, which fly up and down the path in the trees searching for insects.
The trees between the path the river hide a pond and boggy area, with the whole area barely above river level. This is actually a former path of the Thames. If you look at a map of the area you can trace out its likely route, rejoining the current Thames about a mile further north, just short of the railway bridge.
After about 10 minute’s walk, the path joins the river and allows fairly clear views of the water between small shrubs and some moored boats. At this point, it was about 45 minutes after sunset and my bat detector was starting to pick up a different sound, a faster crackly one.
Daubenton’s Bats
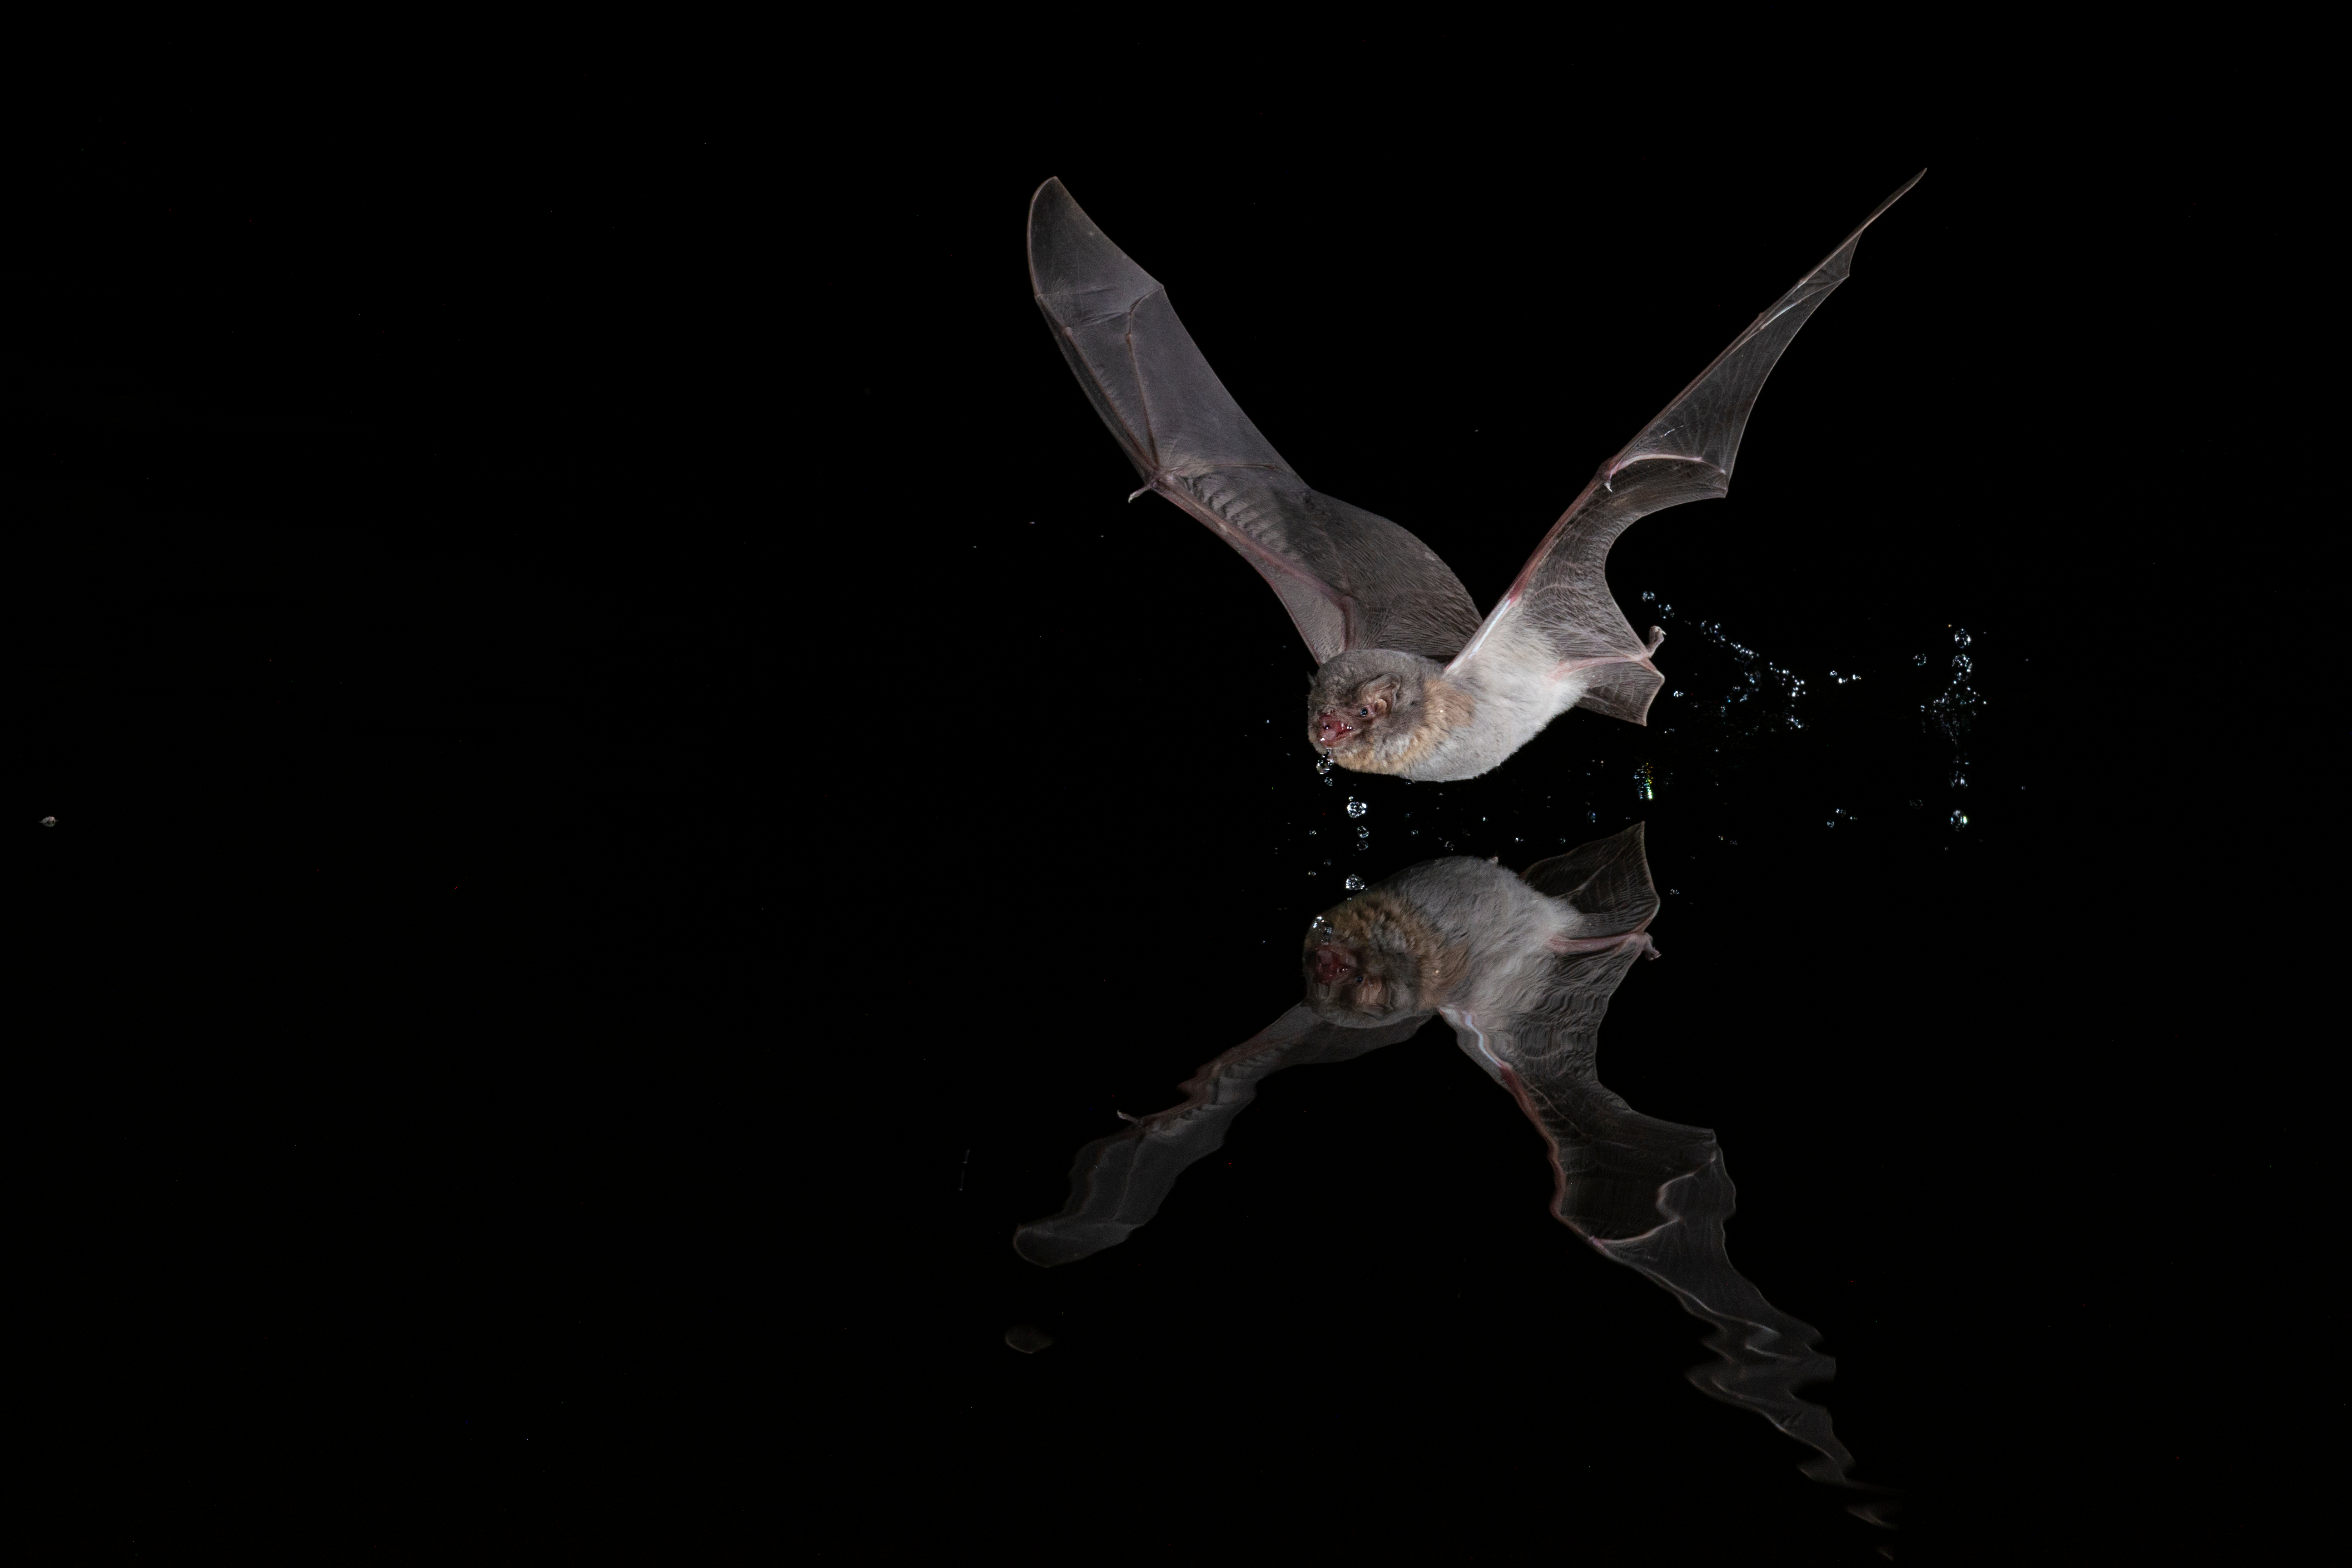
Daubenton’s bats specialise in catching insects from just above the surface of the water, and will even scoop up an insect from the surface with their tail. They emerge a little later after sunset than pipistrelles do, and are to be found on warm evenings hunting for insects over rivers and canals. I notice that they tend to hunt as individuals or in pairs.
It is not always easy to see a small grey animal flitting over dark water just after twilight. One way is to carry a powerful touch or bicycle light. However, it can be hard to locate the bats in the beam, and even harder to keep them there. I find a better method is to find a place on the bank where residual light in the west is reflected off the water from a clear sky, without any trees or obstacles on the opposite bank to cast a shadow. Then it is possible to see the bats and their reflections clearly without the aid of a torch.
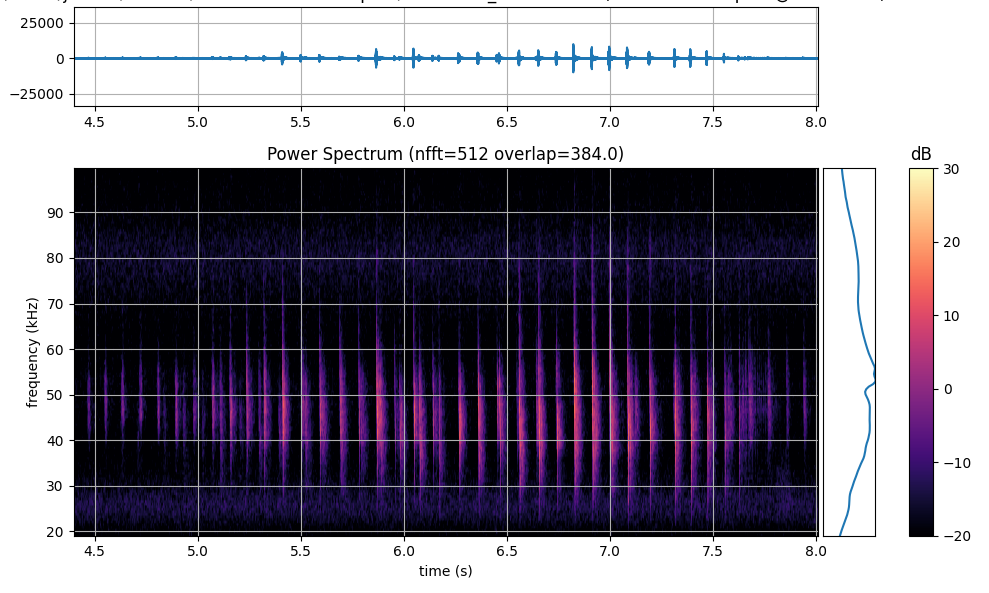
Here is a typical spectrogram of a Daubenton’s bat’s echolocation call.
Here is the sound of a pair of Daubentons hunting, slowed down 15x to be audible. You can hear a feeding buzz at 49s into the track. Notice how distinct the two animals sound, which is not obvious from the spectrogram above. Here’s how that same data sound through a heterodyning detector set to 50kHz – like a rather dry crackling.
Notice that it is very wideband, starting each chirp near 90kHz and dropping to near 20kHz. It is also very rapid, around 12 per second. If you zoom in on single chirp, you can see a slight kink or knee between 40 and 50 kHz.
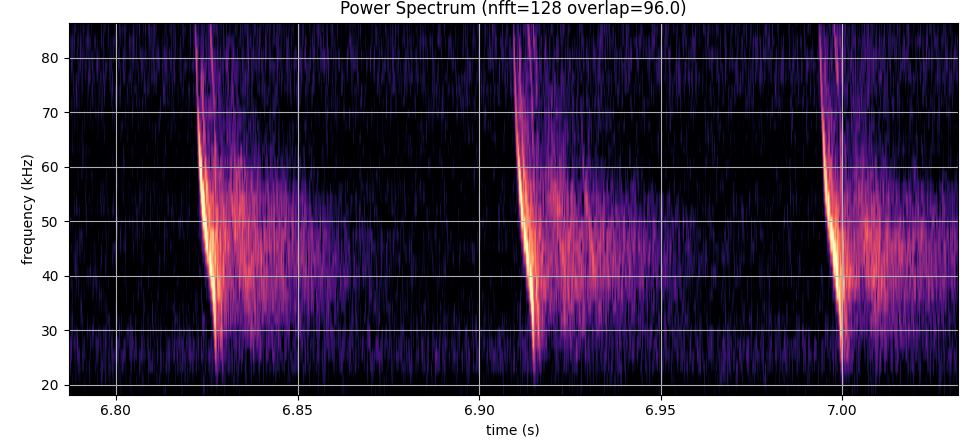
This kind of call is common to all myotis family bats, which are consequently very hard to tell apart based purely on spectrogram. However, a sighting of the bat flying consistently low over water confirms it as a Daubenton’s.
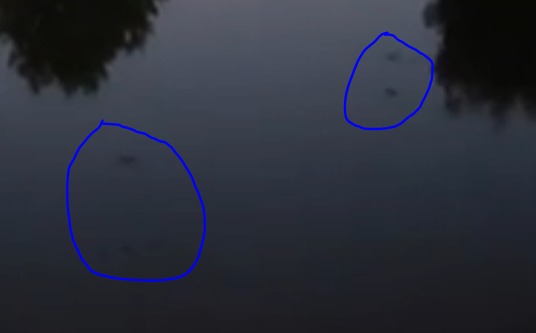
This grainy shot from my phone camera confirms that there are two Daubenton’s bats flying over the river. You can also see their reflections in the surface of the water.
When a Daubenton’s bat locates and catches an insect, its echolocation calls speed up and change pitch somewhat, forming a feeding buzz as shown. Note that there is a second quieter bat in the first part of the spectrogam.
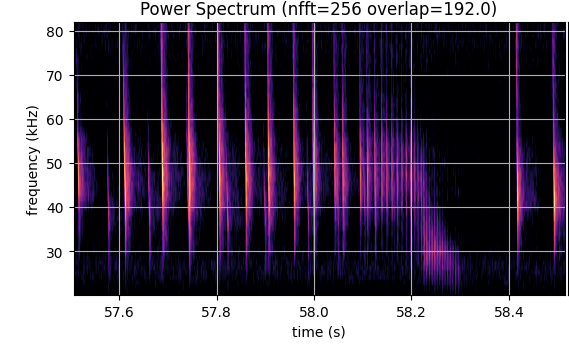
The spectrogram shows how the echolocation chirps speed up on approach to the insect, becoming very rapid, dropping in pitch and finally disappearing entirely as the bat swallows the insect. Then resumes echolocation at its normal speed.
The tail of the feed buzz, showing very rapid chirping at around 180 per second. The chirp width is about 1ms, which corresponds to a distance of about 0.6m at the speed of sound.
Banding
Do you remember the Young’s slits experiment from physics? Two sources of light very close together result in a pattern of light and dark bands. This results from interference between light that arrived via paths of different lengths – if the path difference is half wavelength, the light cancels and there is a dark band.
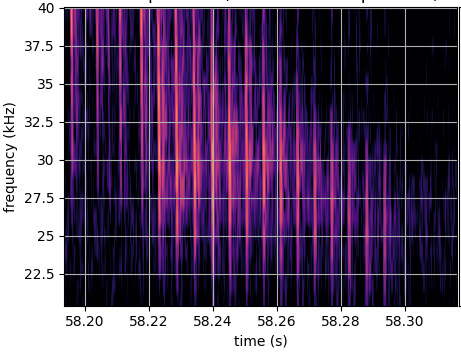
The same happens with Daubenton’s bats. Their chirps arrive directly from the bat, but also reflected from the surface of the water. In effect, the bat and its reflection are coherence sources of the same sound which arrive having taking routes of different lengths. As with light, loud and silent bands result, depending on the position of the bat relative to the water and the listener, and the wavelength of sound.
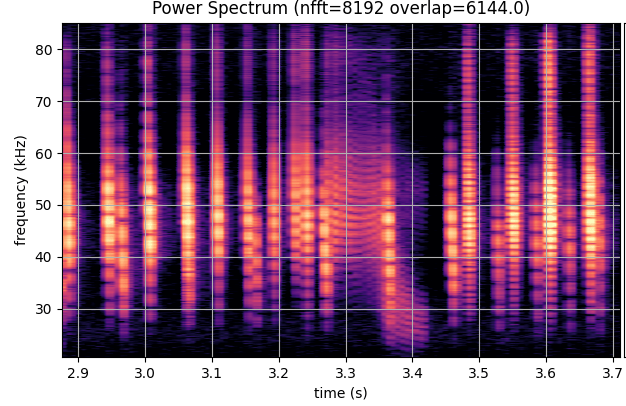
When the spectrogram is viewed with high resolution for frequency, banding becomes very obvious. This results from interference between sound arriving directly from the bat, and sound arriving having reflected from the surface of the water. This effect is characteristic of Daubenton’s bat spectrograms.
Frequency versus Time
Spectrograms are created by applying the Fast Fourier Transform algorithm to the raw audio data. Batches of audio samples are individually transformed and plotted on a heat chart to show how the frequency spectrum of the sound evolves over time. Each batch is also subject to a Hann window to remove artifacts that would otherwise result in unreal elements in the spectrum. Batches are overlapped to create a smooth chart.
The size of the batch is a power of two, and typically 256, 512, 1024, 2048…. The larger the batch size, the greater the frequency resolution is, at the expense of time resolution. That means you have to trade off frequency and time resolution. Notice for example, in the banding spectrogram (batch size 8192), the frequency is sharp but the width of each chirp is rather blurred. On the other hand, in the rapid feeding buzz spectrogram (batch size 128), the chirps are sharp in width but blurred in frequency.
The maths is similar to that behind Heisenberg’s uncertainty principle, though the physics isn’t.
